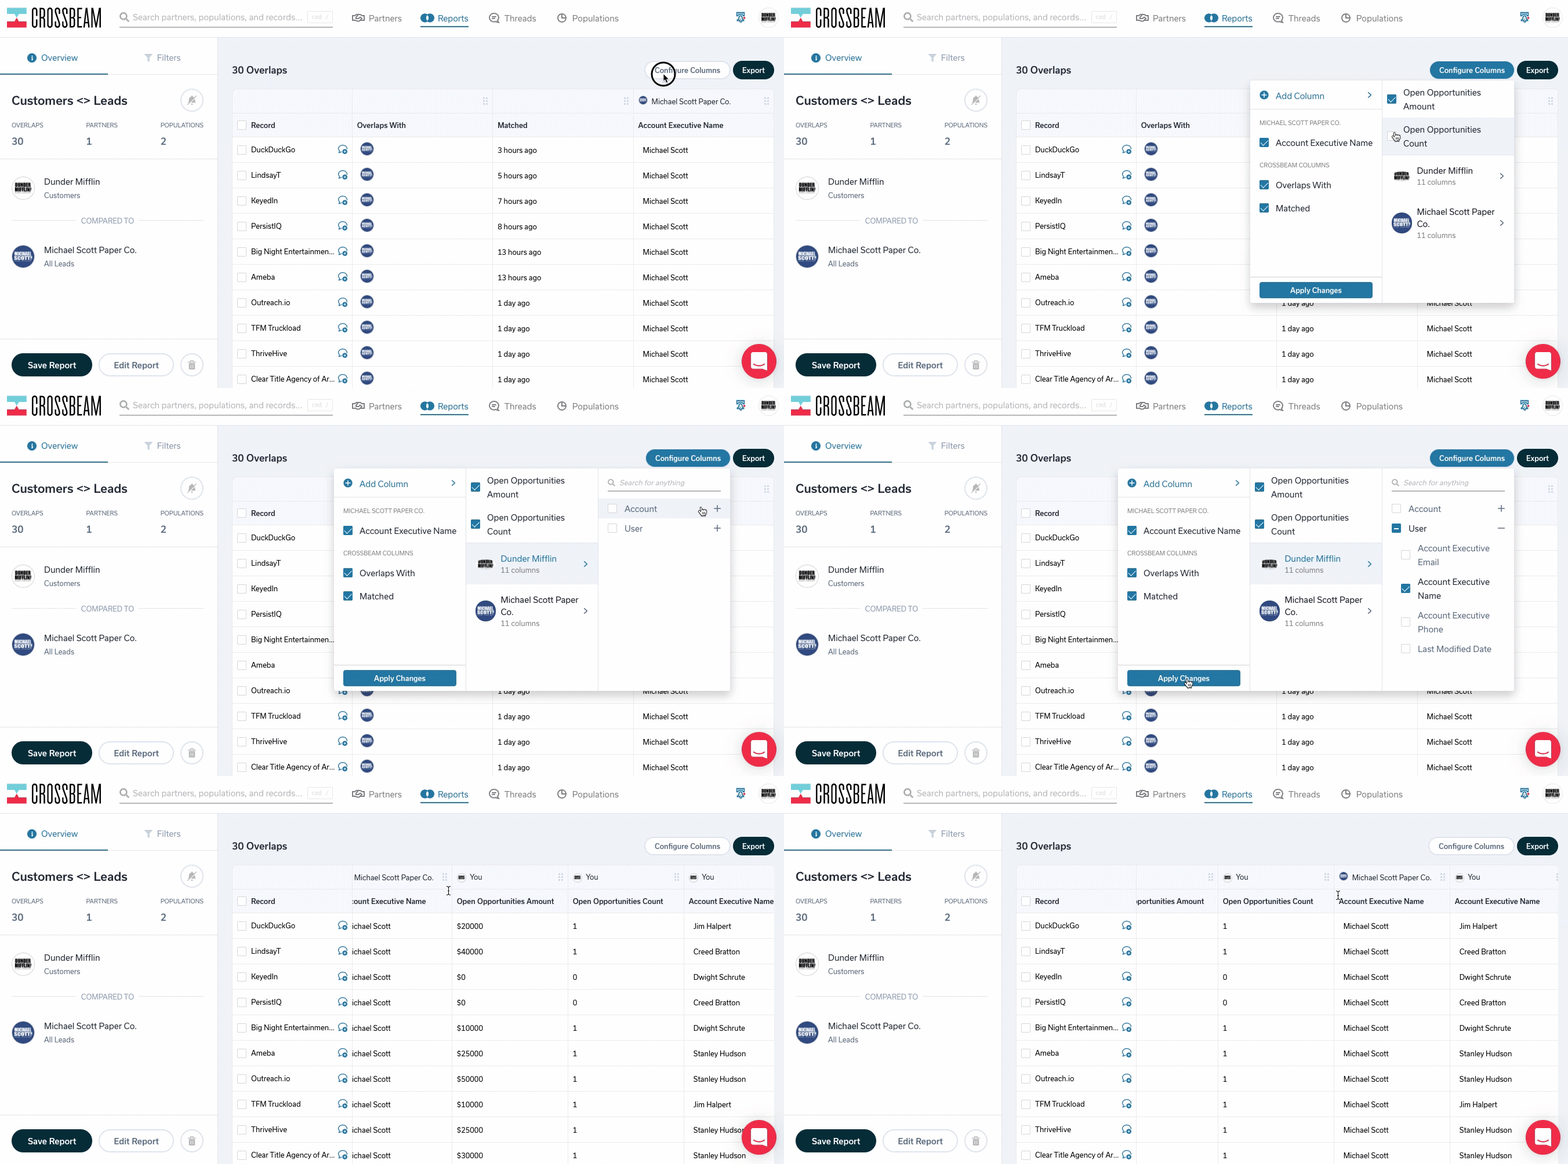
You didn’t get in this game to fiddle around with spreadsheets all day. That’s why we’re excited to share some big improvements to Crossbeam that will make navigating and creating Reports a much faster, easier experience.
New Report UI
It’s a rethinking of our most powerful tool to enable you to filter, mix, and organize your data to surface quality insights (and EQLs) from your partner ecosystem.
Configure visible columns as well as drag and drop them in your preferred order right in Crossbeam. Get (even more) control over your reporting environment, allowing you to unearth hidden insights and revenue.
And, as a bonus, if you export your data to a spreadsheet, it will mirror your new setup.

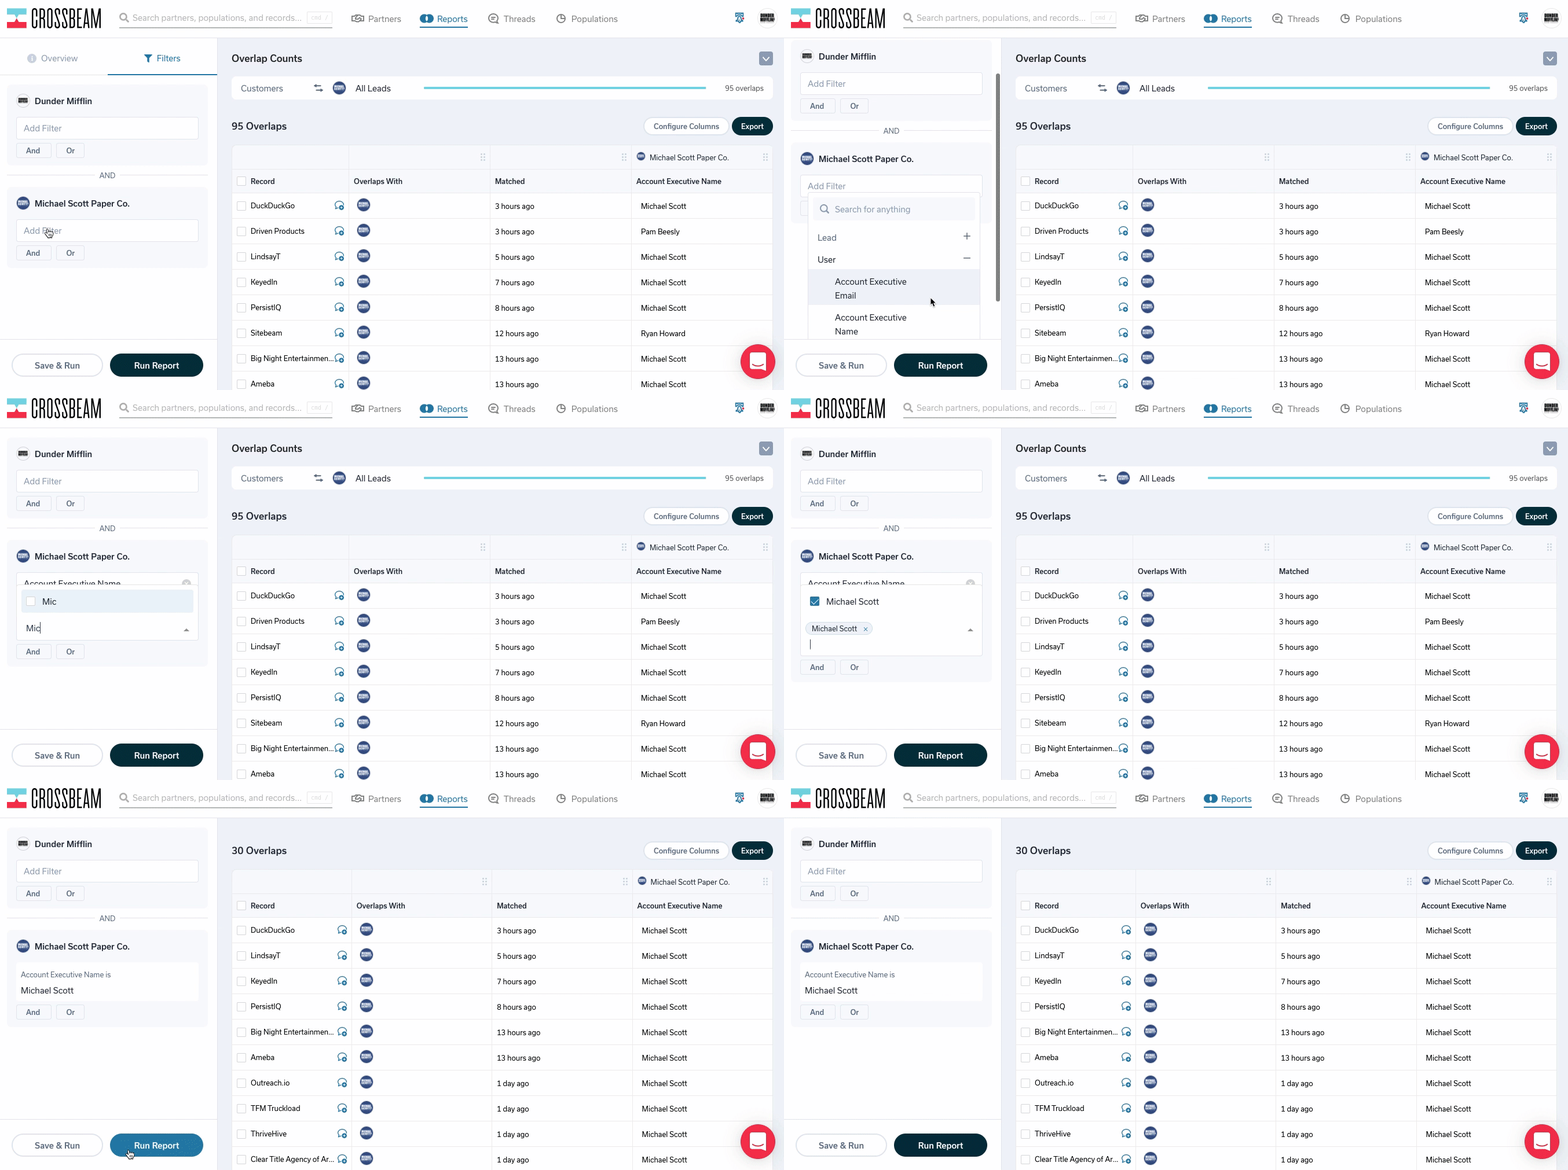
Get granular with your filters
Before, Crossbeam pioneered the ability to compare multiple partners. Now, we’ve taken it to the next level by allowing you to filter using your partner’s data. Now you can filter accounts by a particular AE, region, or whatever other fields your partners have shared with you.
Build reports that are as sophisticated — and unique — as your partner program.

If you’re eager to play around with the new features, head on over to your Reports page.
Or, our help documents have everything you need to get started.
Turn your ecosystem into your #1 revenue source
Get started in under a minute. Instantly capture insights from your partners. Identify more opportunities. Did we mention it’s free?


